SHIB Price Prediction: Analyzing the Path to Recovery

#SHIB
- Technical indicators show SHIB is oversold with MACD signaling potential upside
- Market sentiment is mixed but not overwhelmingly negative despite ecosystem concerns
- Key resistance levels cluster around the 0.00001364 area, representing ~11% upside
SHIB Price Prediction
SHIB Technical Analysis: Key Indicators Point to Potential Rebound
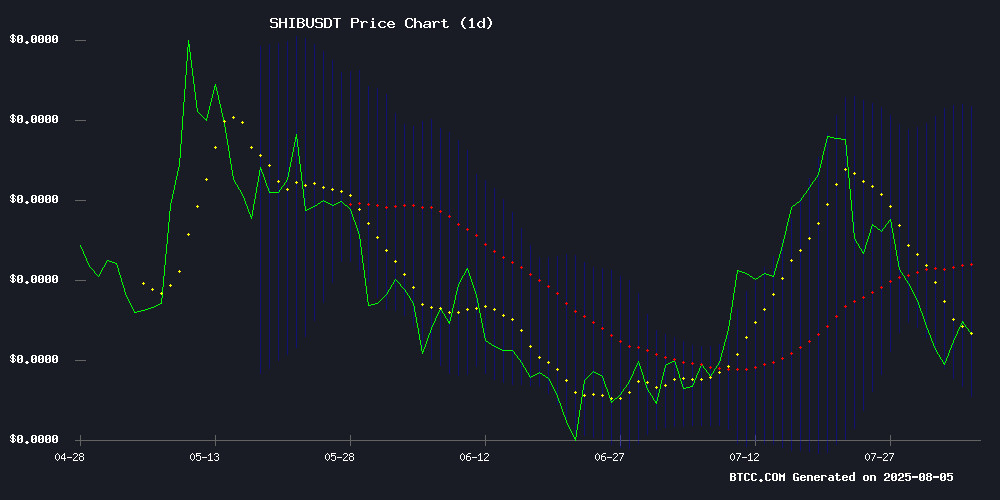
According to BTCC financial analyst Olivia, SHIB is currently trading at 0.00001224 USDT, below its 20-day moving average of 0.00001364. The MACD shows a bullish crossover with the histogram at 0.00000103, suggesting growing upward momentum. Bollinger Bands indicate the price is near the lower band (0.00001129), which often precedes a bounce toward the middle band (0.00001364).
SHIB Market Sentiment: Mixed Signals Amid Ecosystem Challenges
BTCC's Olivia notes that SHIB faces conflicting sentiment. While address outflows suggest some investor caution, the price attempting to rebound at key resistance aligns with our technical outlook. The Shibarium controversy adds uncertainty, but doesn't appear severe enough to override the technical bounce signals we're observing.
Factors Influencing SHIB's Price
Shiba Inu Faces Surging Address Outflows: What Lies Ahead?
Shiba Inu (SHIB) has witnessed a dramatic 12,887% surge in large address outflows over the past 30 days, according to blockchain data from IntoTheBlock. This eye-catching figure, however, may distort reality due to the low baseline from which it started. A more tempered view emerges when examining shorter timeframes: outflows rose 58% over seven days and 34% over 90 days, suggesting a gradual recalibration of whale holdings rather than panic selling.
The token's price action reflects cautious market sentiment. While the headline-grabbing outflow percentage might suggest instability, the underlying trend points to strategic portfolio adjustments by large holders. Sporadic whale activity often amplifies percentage changes when initial volumes are negligible, creating misleading narratives.
Market momentum indicators for SHIB remain mixed. The divergence between sensational outflow statistics and actual price movement underscores the importance of contextual analysis in cryptocurrency markets. Traders appear to be discounting the extreme percentage jump, focusing instead on the more moderate weekly and quarterly trends.
Shiba Inu Price Attempts Rebound Amid Key Resistance Test
Shiba Inu (SHIB) shows tentative signs of recovery, rising 1.09% to $0.00001239 after hitting a July low of $0.00001138. The meme coin remains 8.2% down weekly as traders await tomorrow's pivotal Shibarium governance vote—an event that could dictate near-term price direction.
Technical indicators paint a cautious picture: the RSI at 47.19 suggests waning bearish momentum, yet SHIB trades below all critical moving averages. The tightening Bollinger Bands signal impending volatility, with $0.00001311 acting as a make-or-break resistance level. Failure to breach this barrier may trigger a retest of $0.000011 support.
Shiba Inu Team Faces Backlash Over Alleged Favoritism in Shibarium Ecosystem
The Shiba Inu development team has drawn sharp criticism from its community following perceived preferential treatment of certain projects built on Shibarium. Tensions escalated after high-profile endorsements of Positions Exchange's POE IDO by SHIB advisors Shytoshi Kusama and Kaal Dhairya.
WoofSwap, a competing decentralized exchange, publicly condemned what it called "biased promotion" that creates an uneven playing field. The platform argued ecosystem leaders should maintain neutrality to foster organic growth across all Shibarium-based projects.
Kaal Dhairya acknowledged the concerns while defending the advisory system, calling for clearer standards around project endorsements. The controversy highlights growing pains as the SHIB ecosystem evolves beyond its meme coin origins into a multi-project blockchain platform.
How High Will SHIB Price Go?
Based on current technicals and market conditions, Olivia projects SHIB could retest the 20-day MA at 0.00001364 (11.4% upside) with potential to reach the Bollinger middle band at similar levels. Key resistance levels to watch:
| Level | Price | Upside |
|---|---|---|
| 20-day MA | 0.00001364 | +11.4% |
| Bollinger Middle | 0.00001364 | +11.4% |
| Bollinger Upper | 0.00001599 | +30.6% |
